VISUALIZING THE BRAZILIAN DIASPORA IN THE U.S.A.
This project was developed in partnership with Boston University’s Spark Lab. The Spark Lab is a technology incubator and experimental learning lab for student-led computational and data driven projects at Boston University.
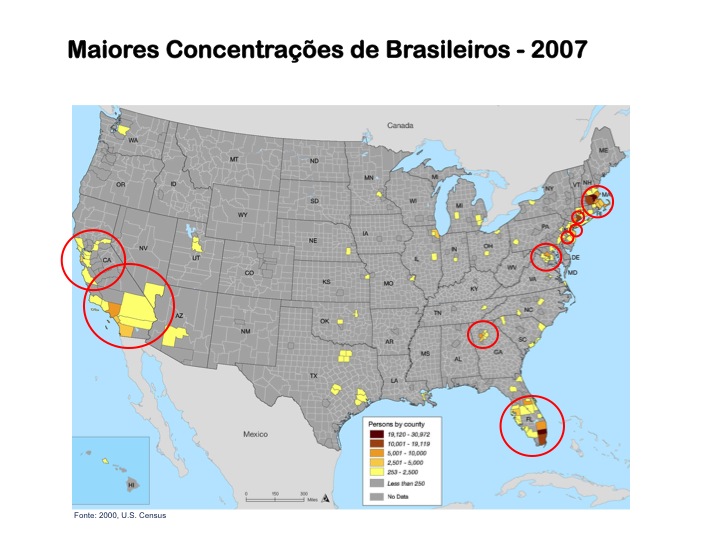
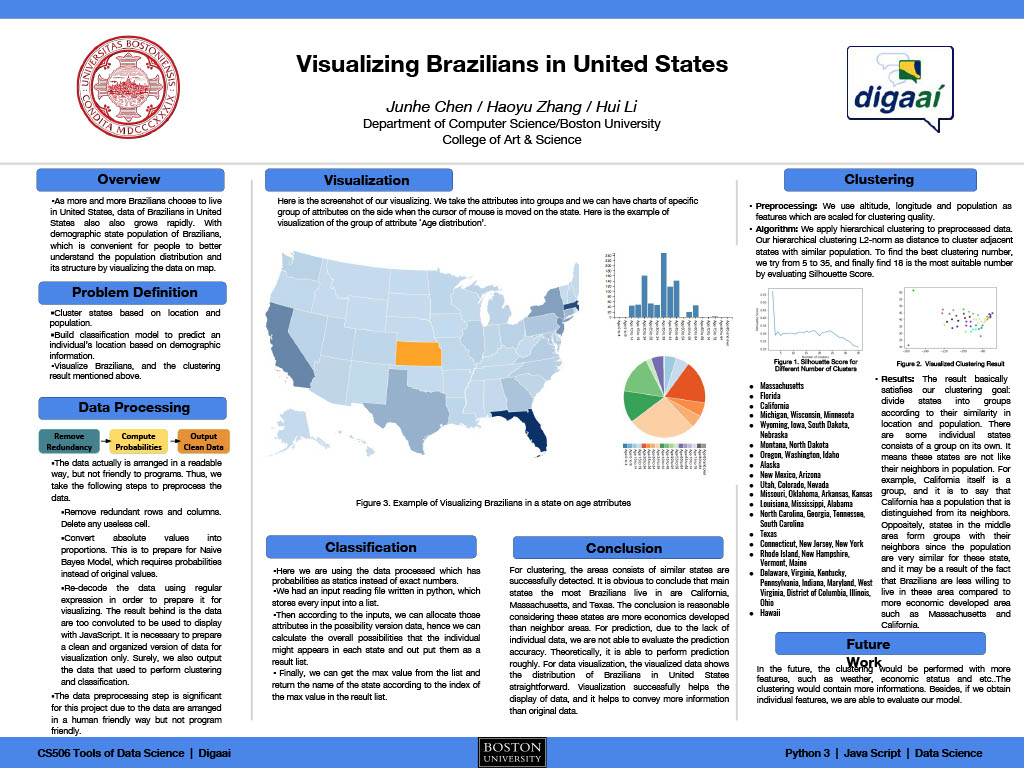
As part of the CS 506 class, students Junhe Chen, Haoyu Zhang, and Hui Li, under the supervision of Dharmesh Tarapore and Alvaro Lima, developed a platform to visualize the Brazilian population in the United States utilizing U.S. Census data.
The Spark team analyzed the different attributes in the data set of the U.S. Bureau of Census for the distribution of Brazilians in different states and tried to extract the best representative tags or features about Brazilians in an area. The tags were normalized and vectorized in order to perform a hierarchical clustering algorithm so that users could zoom in on the map to show more detailed information in the corresponding region.
A primary goal of the data visualization was to communicate information clearly and efficiently via statistical graphics, plots, and information graphics. Numerical data was encoded using dots, lines, or bars, to communicate a quantitative message visually. Effective visualization helps users analyze and reason about data and evidence. It makes complex data more accessible, understandable, and useable.
Besides the data from the U.S. Census Bureau, the project also uses data from Ministério das Relações Exteriores do Brasil (MRE). Because MRE provides only a count of Brazilians in the U.S., we used the U.S. Census distribution of Brazilians by State and applied this distribution to the total population provided by the MRE.
To access the visualization click here: VISUALIZING THE BRAZILIAN DIASPORA.
The project proposal can be accessed here: CS_506_Proposal.
A final poster is available here: CS_506_Final_Poster.
A complete description of the project and its methodology can be founded here: CS_506_Final_Report.
|
Users may have particular analytical tasks, such as making comparisons or understanding causality and the design principle of the graphic followed these tasks. Tables were generally designed so that users can look up a specific measurement. In contrast, charts of various types show patterns or relationships in the data for one or more variables. |
 |
The front end of the visualization was designed so that the data could be displayed on a map and plotted on charts so that attributes could then be shown as the user moves the cursor of the mouse onto the area of a state in the browser or click on a attribute on the charts so that this attribute is displayed on the map.
The project was sponsored by Digaai, today, the Instituto Diaspora Brasil (IDB).
Brasileiros na Espanha
Entre a segunda metade do século XIX e começo do século XX, houve uma grande emigração de espanhóis para a América Latina sendo o Brasil o terceiro país de maior destino destes. Este processo se inverte na década de 80 com o Brasil enviando um número crescente de seus cidadãos pra aquele país.
Brasileiros no Paraguai
A grande migração brasileira de “fronteira agrícola,” para o Paraguai está ligada aos incentivos oferecidos pelo governo daquele país seguindo a sua política de desenvolvimento agrícola durante o governo Stroessner (1954-1989). Estas políticas incluíram a criação de mecanismos de atração via a outorga de extensas …
Brasileiros na Alemanha
Segundo dados de 2008 do Departamento Federal de Estatística da Alemanha, vivem no país por volta de 73.000 imigrantes sul-americanos. A maior parte deles é composta pelos cerca de 23.000 brasileiros, 10.000 colombianos, 9.000 peruanos e 4.500 equatorianos. Na Alemanha o contigente feminino entre os imigrantes brasileiros é …
Brasileiros no Uruguai
A migração brasileira para o Uruguai iniciou-se nos anos 70, constituída na sua maioria por pequenos produtores sem terra. Nas décadas posteriores, esse fluxo começou a ser formado por grandes proprietários do Rio Grande do Sul e São Paulo. Segundo Reydon & Plata (1995), cerca de 10 por cento do território uruguaio pertencia a estrangeiros…
Brasileiros na França
A história das relações franco-brasileiras tem início no século XVI, com o projeto de criação da “França Antártica”, uma colônia francesa em terras brasileiras que eram na época domínio da Coroa Portuguesa (TAVARES, 1979). O empreendimento embora tenha conhecido certo sucesso, foi completamente derrotado pelos portugueses em 1565.
Brasileiros Mundo Afora: Quem e Quanto Somos, Porque Emigramos, Onde Vivemos, Porque Retornamos e Quanto Contribuímos
Historicamente, o Brasil pode ser considerado um país receptor de população. Ao longo da sua história acolheu imigrantes de vários países do mundo. De 1822 até 1949 o país recebeu cerca de cinco milhões de imigrantes, sobretudo portugueses, italianos e espanhóis além de japoneses, alemães, poloneses e sírio–libaneses. Pode-se identificar esse fluxo em três grandes correntes …
HEMEROTECA
HEMEROTECA A imprensa étnica tem um papel fundamental no processo de integração econômica e social dos imigrantes nas novas sociedades ao ajudá-los a perseguir seus sonhos, recriar as redes sociais desarticuladas durante o processo migratório ao mesmo tempo que...
Organizações Midiáticas
Organizações Midiáticas INTRODUÇÃO O levantamento sobre a mídia brasileira emigrante, realizada pelo Ministério das Relações Exteriores do Brasil, registrou 216 veículos midiáticos de vários tipos (FIRMEZA, 2007), incluindo a existência da Associação Brasileira de...


